
Geography Awareness Week Student Spotlight: Ashley Jackson
Geography Awareness Week (November 15–21) will be here soon. In honor of the occasion, we’re spotlighting Ashley N. Jackson, a doctoral student in the Brown School of Social Work at Washington University in St. Louis. Her research interests include historical and contemporary patterns of police violence, the effects of police contact on psychological well-being, and racial socialization in communities of color.
In the interview below, Dorris Scott, GIS Librarian and Social Science Data Curator at the Washington University Libraries, talks with Ashley about how she became interested in geographic information systems (GIS), her project on mapping historical police violence in St. Louis, and the importance of geographical awareness in relation to social justice.
1. How did you get interested in GIS? I took a class with Haley Becker. She graduated from the Brown School doctoral program in public health a couple of years ago, and she was an adjunct for the Brown School teaching the semester-long GIS intro course. Through Dr. Becker’s class, I learned the basics, like creating static maps. Through that course, I got introduced to the Washington University Libraries’ workshops, which introduced me to the more interactive visualizations of GIS through StoryMaps and things like that. The library workshops introduced me to different and more creative ways to use mapping in some of the work that I do.
2. Can you tell me about your project Mapping Historical Police Violence in St. Louis? I initially got interested in the topic because I was taking a class with Geoff Ward called Racial Violence. We talked a lot about how you interrogate historical patterns of violence and how legacies of racial violence can occur throughout history and connect to issues we are seeing today.
The assignment in that class is to carry out a project and figure out ways to not only identify but explore further how legacies of racial violence manifest in today’s time. I was interested in this historical piece. I was always thinking about racial violence in terms of police violence in the present time without necessarily taking a moment to think about how this connects to past trends and how the patterns we see today are relics of the past. They’re not new.
Dr. Ward had mentioned to me that the American Civil Liberties Union of Missouri (ACLU-MO) archives were available at the Washington University Libraries in the Julian Edison Department of Special Collections. I sat down with Miranda Rectenwald, who manages the collection, and she walked me through the plethora of data and content that’s in those archives. I noticed that there was a file on police shootings from the late 60s and early 70s, which was on the issue of shooting a fleeing suspect. The St. Louis Police Department had a major issue of shooting people who were running away from a variety of different scenarios, whether they were engaged in a crime or not, and the ACLU-MO was tracking these cases. And a lot of these cases were in local newspapers. Most of these cases had locations. Some of them didn’t, so I had to do some extra digging, and I was able to fill in some of these gaps and find locations.
I was learning about all of this in the midst of taking Dr. Becker’s course. As I was collecting this data, I was able to apply some of the GIS principles that I learned, taking these locations and mapping them and then also weaving in census data. I was learning how to upload, import, and export data to shapefiles from those historical census files. There’s a historical GIS database managed by IPUMS that houses this data. That’s what spurred the project and the StoryMap.
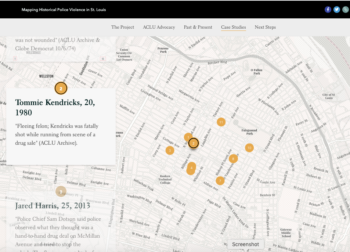
I wanted people to be able to interact with the map online, which ultimately led me to create the StoryMap website. This gives views of the map to unpack the stories to learn a little bit more about the people behind these incidents. The northern part of St. Louis and areas where there’s a larger population of Black people are the ones that have continually been impacted by concentrated police violence over time. This is early evidence that police violence is a persistent issue that’s affecting our communities.
3. Why is it important for you to add a geographic perspective to your work? I think it’s a more visually appealing way to understand a social issue. I think folks get tired of seeing that X number of people have been shot by the police or X number of people are impacted by higher levels of asthma, and so forth. I think that visualizing social issues is a lot more powerful, and some people respond better to the visualization of a problem.
4. What advice do you have for students who are wanting to develop their GIS skills? Definitely take the Intro to GIS course. It gives you the basic nuts and bolts. I think that if you understand how to use ArcMap or ArcGIS Pro and understand GIS operations, such as how to import layers and to convert data to shapefiles, if you transition to a more interactive platform like StoryMap or ArcGIS Online, I think it’s an easier transition. If you have access to the WashU resources, take advantage of those resources. I personally didn’t realize how rich of a set of opportunities and workshops and things like that were available until I took the Intro to GIS class. During the class, Dr. Becker plugged the University Libraries and suggested that we contact Data Services. Libraries are warehouses of information in terms of GIS support and also Special Collections, where there are curators of local history. I’m just shocked at how much support the library offers to students around this topic. It’s really cool.
5. What relationship do you see between geographic awareness and social justice? I couldn’t be learning GIS in a better time, given the technological advances that we have, and the ability to do these kinds of visualizations. I think it amplifies these social issues and awareness around these issues, because we’re able to really quickly visualize them. A lot of this open-source data is now equipped with longitude and latitude information. For example, a slave archive that Harvard manages has FIPS codes, along with longitude and latitude. I think that data managers and data scientists are starting to understand the power of place. I think it’s a perfect marriage, GIS and social issues, because it allows you to explore an issue and really visualize it for the public.
This interview has been edited for brevity and clarity.