Rethinking Furniture Layout in Kopolow Business Library
In today’s rapidly evolving academic environments, the role of furniture extends beyond mere functionality. It shapes the ambiance, influences user behavior, and can significantly enhance the overall experience of patrons. This was the driving thought behind an assessment conducted at the Kopolow Business Library, where my team and I explored the impact of various furniture arrangements on space utilization.
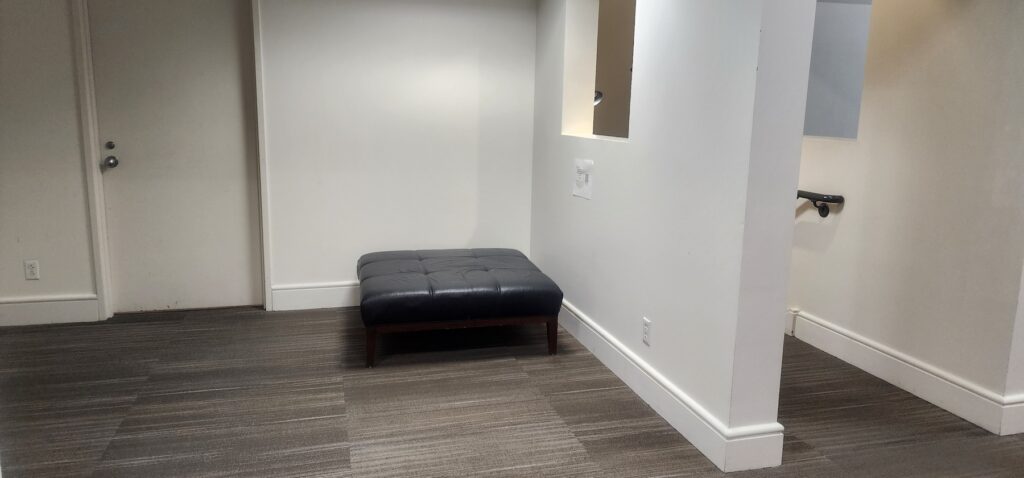
The initial spark for the project came from a simple observation: despite the availability of furniture (soft seats, booths, tables, carrels, etc.) throughout the library, patrons did not use certain spaces at all. It was as if management had put up a sign forbidding their use. The fact that furniture in these spaces was not dilapidated made us think that perhaps the existing furniture layout was a contributing factor. Could rethinking our furniture arrangements transform these spaces into more inviting and functional ones?
To investigate this, we adopted an identification strategy comprising an experiment and the analysis of data from patron surveys, room occupancy counts, and sheer observation. By testing one furniture arrangement at a time for any given space, we could reasonably rule out competing explanations for patron attitudes (as reflected in their survey responses) or behavior (as reflected in room occupancy counts and observations). By analyzing data from room occupancy counts and observations, we could validate patrons’ survey responses.
The assessment was structured in three phases: phase 0 to collect baseline data, and phases 1 and 2 to test different sets of furniture arrangements.
Baseline Data Collection
We began with a comprehensive survey targeting regular library patrons. The instrument focused on three broad themes: community status, library usage, and library space and furniture. The category of community status consisted of questions to help us understand the general identity of the patrons. For example, whether they were undergraduates, graduates, faculty, staff, alumni, etc. And the schools they were affiliated with such as Arts & Sciences, Brown School, Olin Business School, etc. Questions under library usage were designed to identify how patrons used the library. For example, how often they visited, how long they stayed, and what they did during their visit – read, write, socialize, study alone, etc. Library space and furniture had questions that shed light on which spaces patrons used during their visit as well as their general impressions of elements such as furniture layout, furniture comfort, noise levels, safety, temperature, etc. Respondents were also allowed to tell us anything across themes, about which we hadn’t asked.
In addition to the survey, which we fielded over a seven-month period—three months for the baseline and two months each for phases 1 and 2—we also observed how patrons used library furniture and counted how many of them used the various spaces. For three months, designated library personnel counted the number of patrons at various spaces twice a day — at 11:00 and 13:00. During this time, they also made a note of how patrons were using furniture, for example, “…the booths are full…”, “…soft seating by the windows is empty…”, etc.
Experimentation with Arrangement Set One
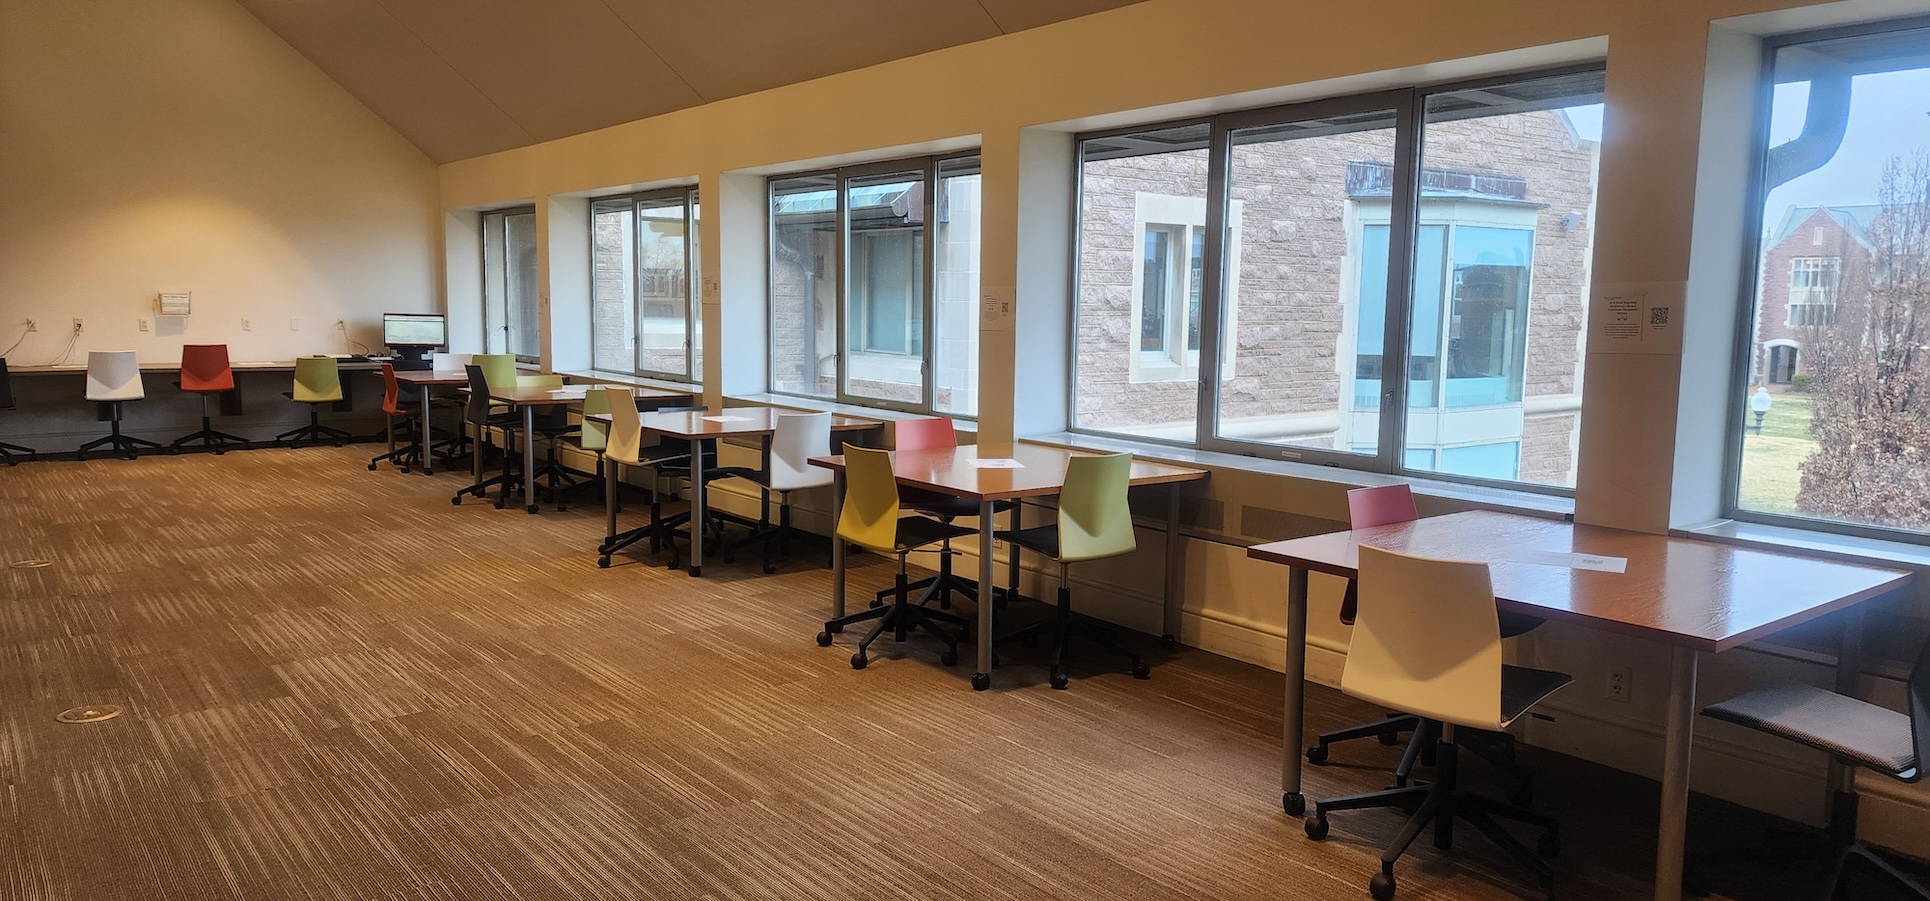
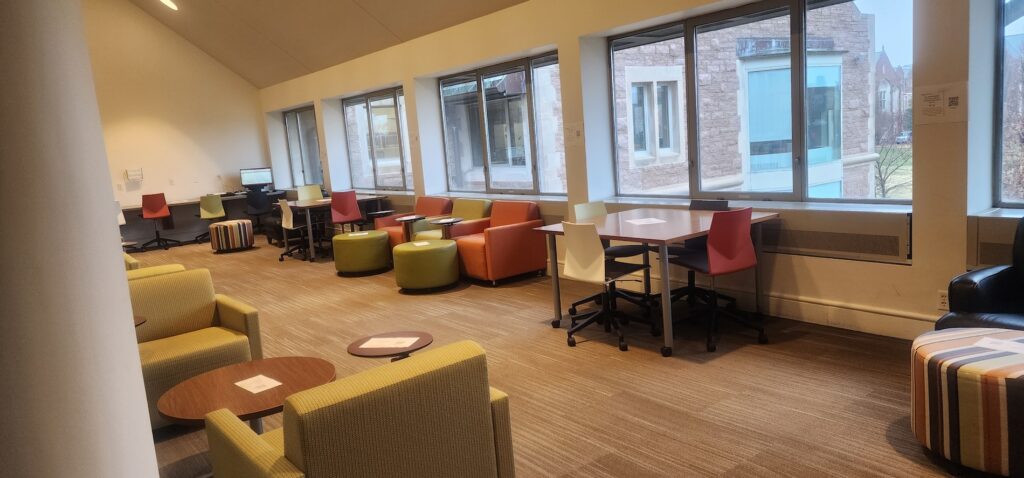
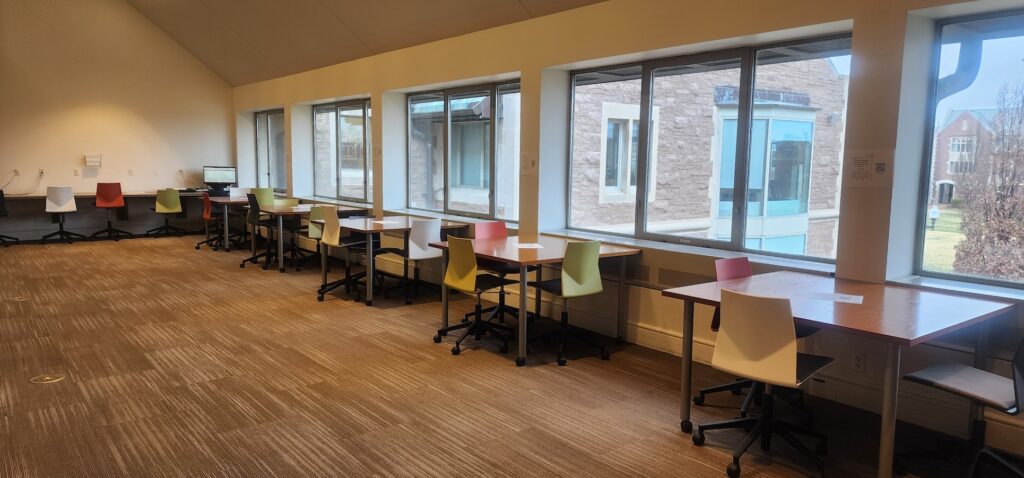
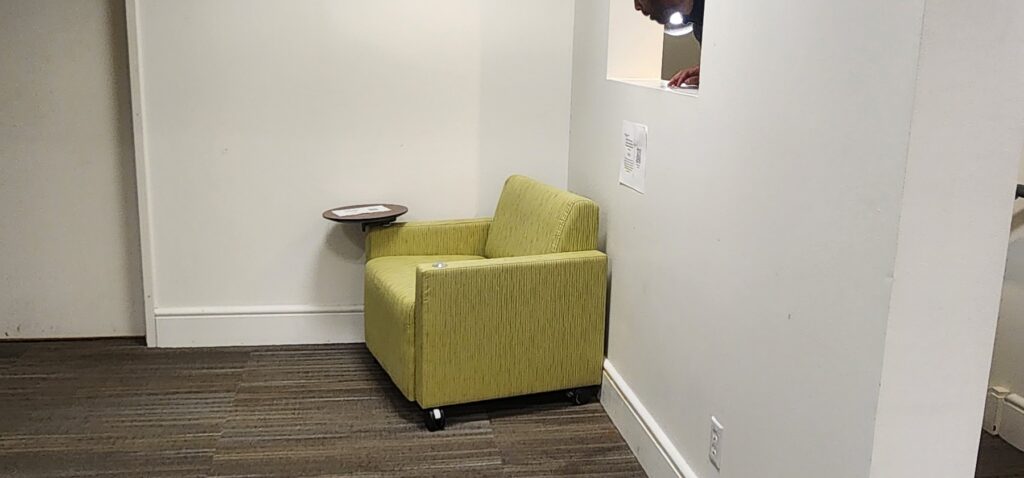
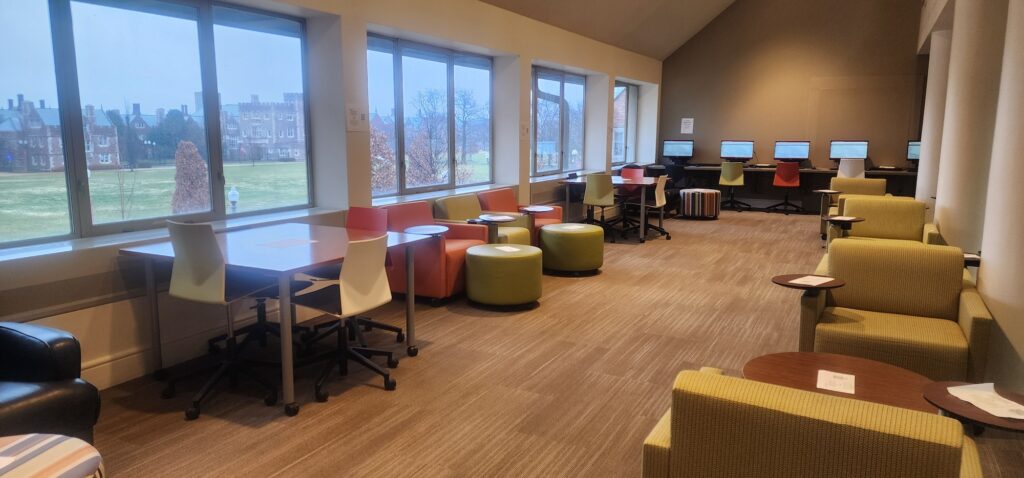
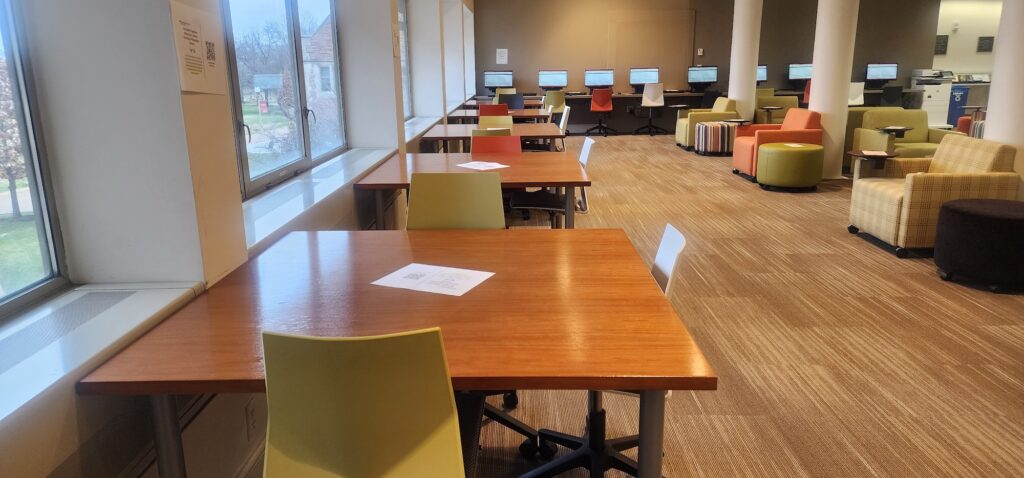
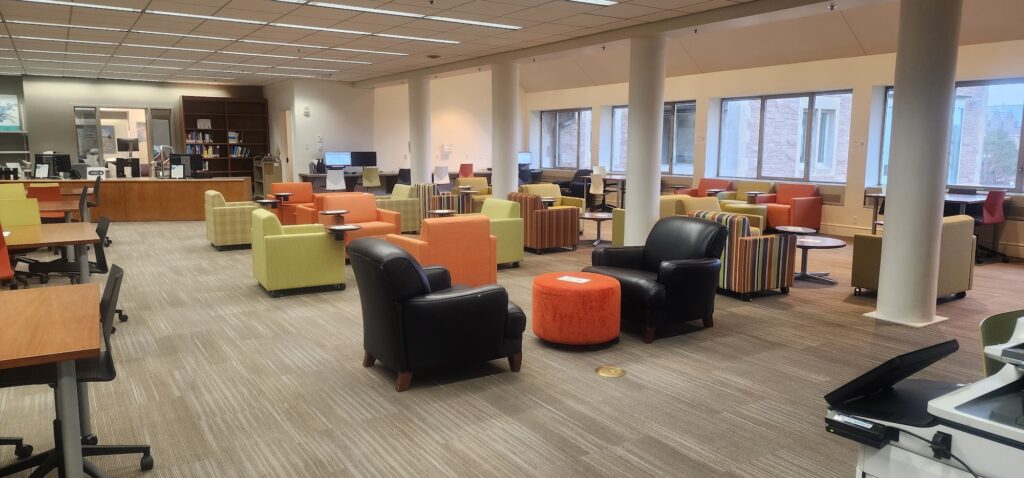
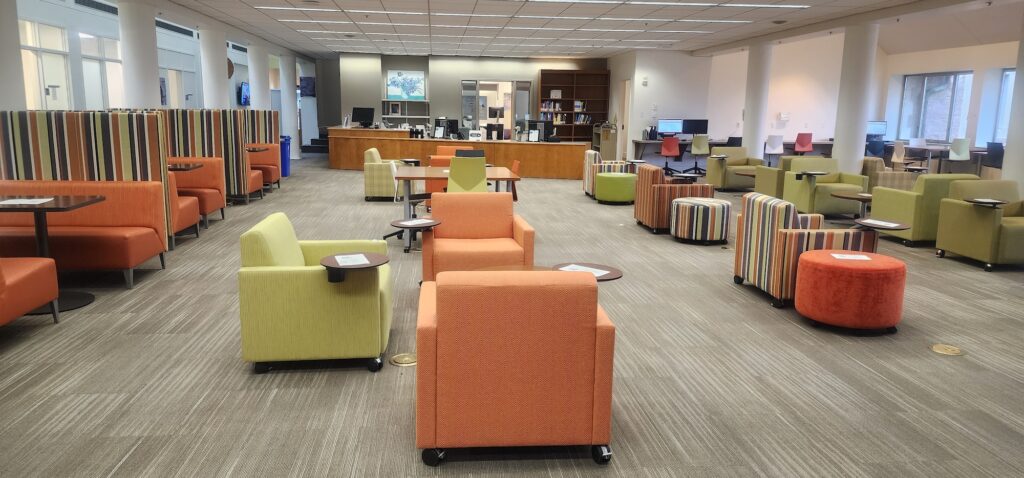
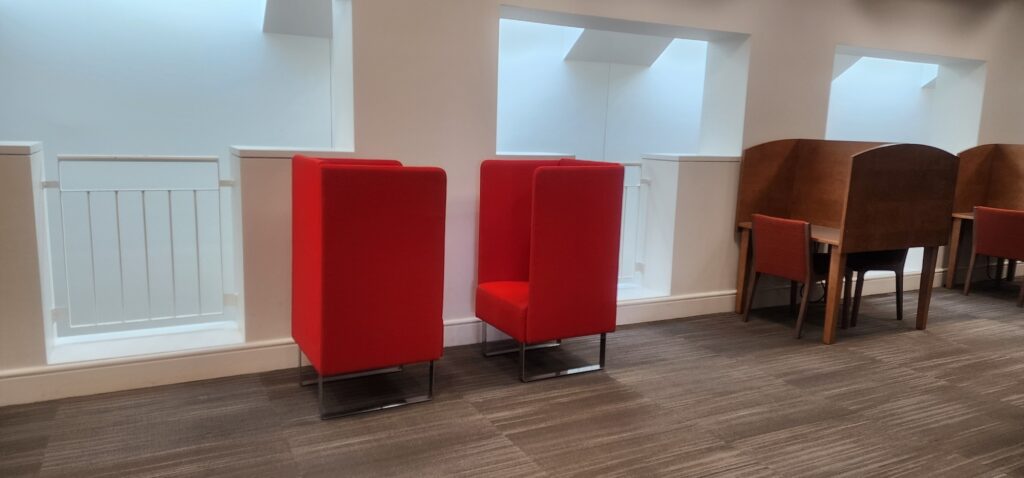
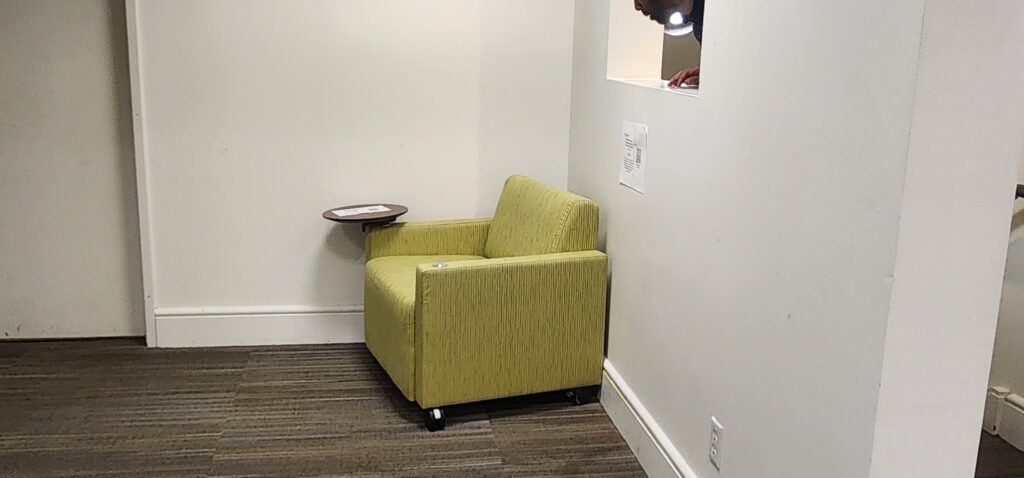
We tested three furniture arrangements between January 13, 2024 and March 15, 2024. During this period, we continued to field the survey, observe patrons, and count how many of them were using the various spaces in the Business library. In the first arrangement (figure A), we replaced soft seating by the windows of the first-floor main area with tables. We replaced the black ottoman on the second floor with a green soft seat from the first floor in the second arrangement (figure B). In the third arrangement (figure C), we re-positioned soft seating across the windows of the first-floor main area to face them. Finally, the team re-arranged soft seating near the booths (figure D). Before and after photos of the three arrangements are shown in Figures A, B, C, and D below.
Experimentation with Arrangement Set Two
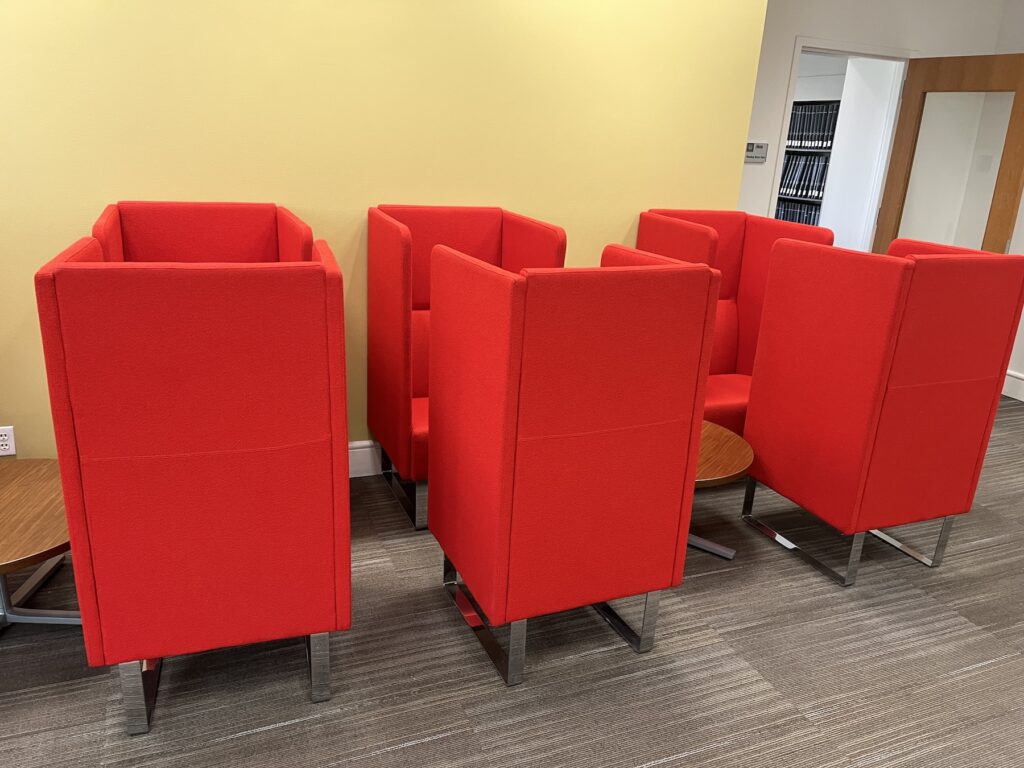
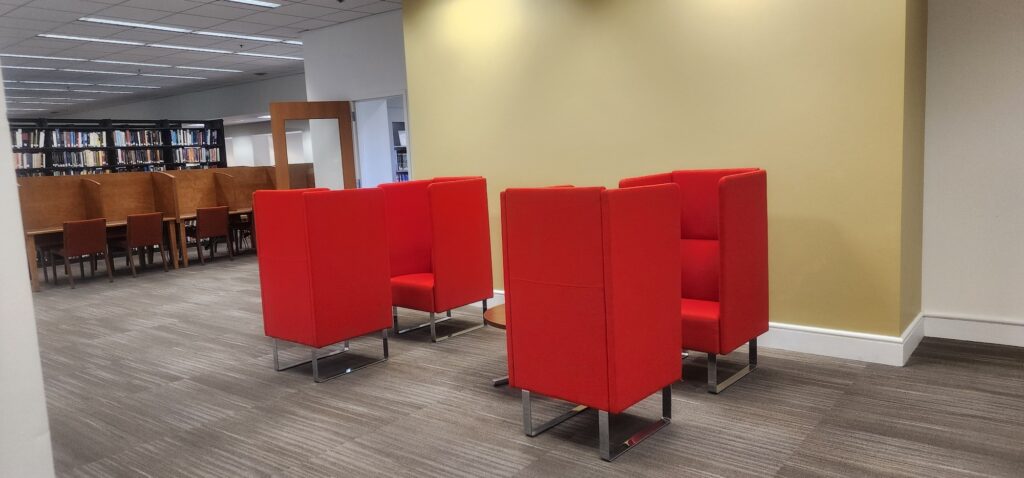
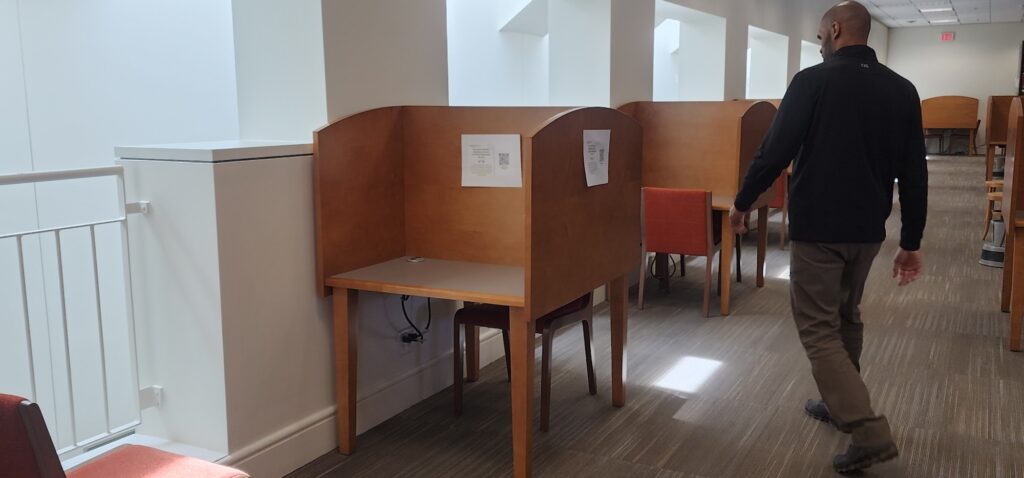
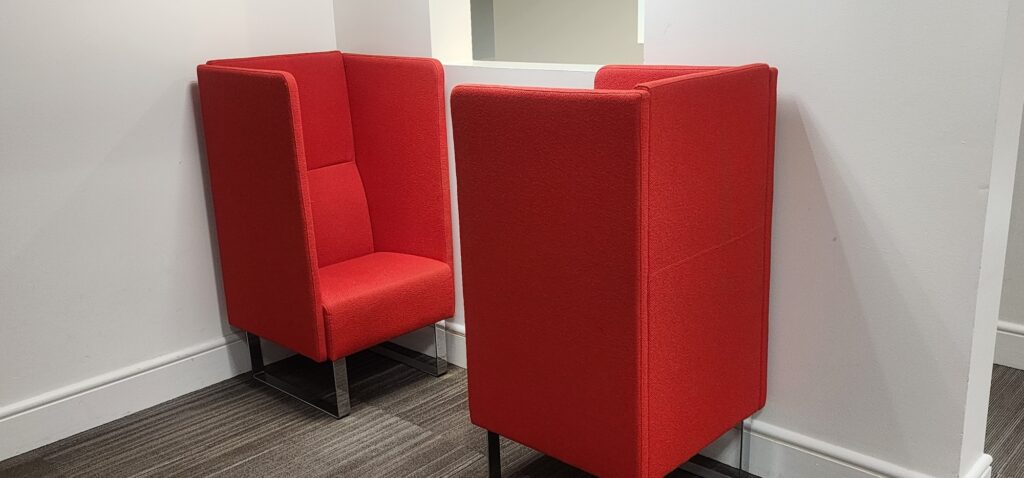
During the period between March 15, 2024 and May 15, 2024, we tested three more arrangements. For the first (figure E), we reduced the number of soft red seats on the second floor from 8 to 4. For the second (figure F), we replaced the carrel on the second floor with two of the soft red seats from the first arrangement. For the third (figure G), we replaced the soft green seat (from phase 1) on the second floor with the remaining soft red seats from the first arrangement. Please see figures E, F, and G below for before and after photos of the three arrangements.
Key Findings
It’s important to note that our goal going into this assessment was to make reasonable, local estimates of the effects that different furniture arrangements have on patrons’ use of space. And to use this knowledge to improve the situation at the Business Library, specifically, patrons’ inefficient use of space. Thus, our purpose was more practical and focused on addressing a specific need.
After analyzing data from the survey, observations, and room occupancy counts, we learned that two out of three arrangements tested in phase 1 increased patrons’ use of the corresponding spaces. Specifically, replacing soft seating by the windows of the first-floor main area with tables increased the usage of the space in that area (figure A). As did re-positioning soft seating across the windows of the first-floor main area to face them (figure C). And re-arranging soft seating near booths (figure D). Of the three arrangements tested in phase 2, only one increased patrons’ use of the corresponding space. And that was replacing the soft green seat (from phase 1) on the second floor with two soft red seats (figure G).
We also learned some things about patrons that may inform library space design more broadly. For example, we learned that most patrons are undergraduates; affiliated with Olin Business School or the School of Arts & Sciences; visit the Business Library in person up to two times per week; stay for one to three hours per visit; study alone during their visit; use one to two spaces during their visit; feel safe during their visit; can find their way to their desired space with little to no difficulty; and think that furniture comfort can be improved. To be sure, these are statistical summaries and do not imply an absence of deviations.
The Team
The Kopolow Furniture Assessment was carried out by a cross-departmental team consisting of staff from the Kopolow Business Library, Library Space and Building Operations Management (LSBOM), and Assessment & Analytics. The Business Library provided context and suggestions for furniture arrangements to be tested. LSBOM advised on the maintenance of the structural and aesthetic integrity of the various spaces. They also oversaw the actual movement of library furniture. Assessment & Analytics guided study design, data collection, and data analysis. Members of the team are listed below:
- Felicia Fulks, Asa F. Seay Business Librarian
- Ellen Riney, Business Library Associate
- Sarah Laaker, Associate University Librarian
- Paul McArthur, Head of Library Space and Building Operations Management
- Bryan Henderson, Building Operations and Services Supervisor
- Jessica Kleekamp, Head of Assessment and Analytics
- Oswald Codjoe, Assessment & Analytics Coordinator
In conclusion, our journey of creating efficient library spaces has been illuminating. It reaffirms the pivotal role of furniture in shaping user experiences and sets the stage for ongoing innovations to better serve our patrons. As we continue to refine our spaces, the goal remains the same: to create an environment where every patron feels welcomed, comfortable, and inspired to explore the wealth of knowledge within the libraries.