Data Services Supports Faculty Research Using Spatial Analysis
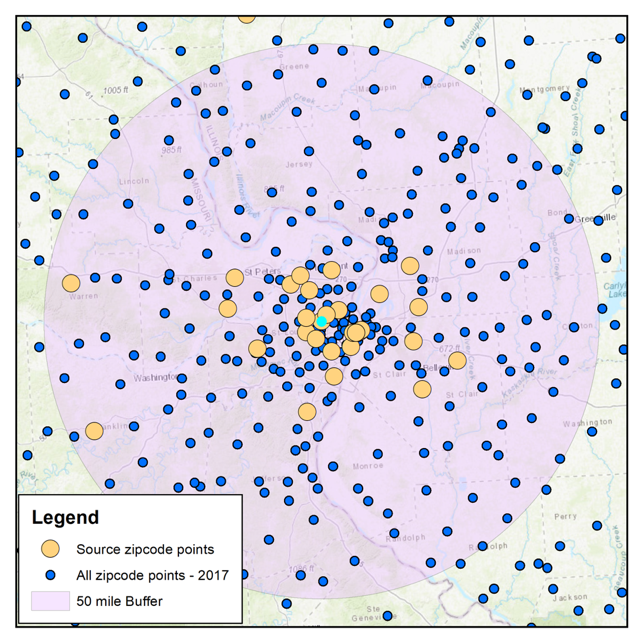
The Data Services team offers spatial analysis services that can boost many types of research projects. A recent request from Radha Gopalan, Professor of Finance in the Olin Business School, provides a great example of the types of questions we regularly field and the services we provide. Professor Gopalan wanted to generate a paired listing of all neighboring zip codes within 50 miles of a list of “source” zip codes. This may seem like a fairly simple request, but there are several issues to consider, the main one being that zip codes do not actually represent polygon areas.
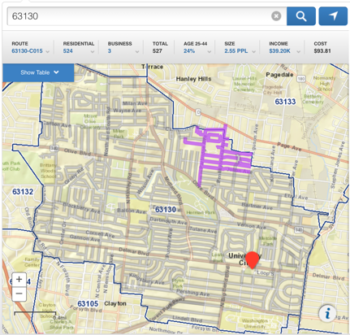
The U.S. Postal Service offers an online tool that allows users to visualize the routes that make up individual zip codes. The figure below shows the routes in Washington University’s 63130 zip code. The blue line roughly encompasses the zip code area, while the thick gray lines represent all of the 63130 routes. The purple line highlights one of the routes and illustrates that a route can sometimes extend beyond the zip code boundary.

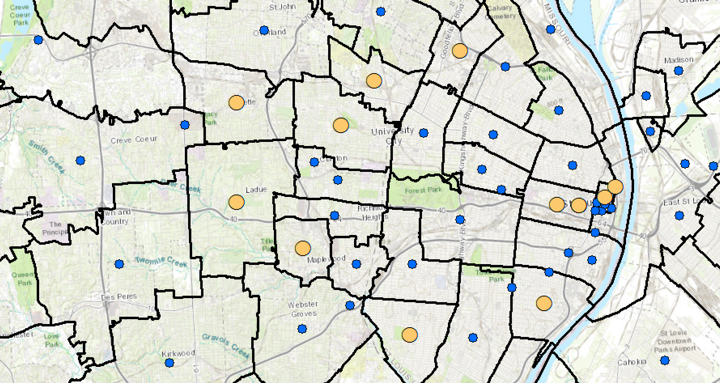
The USPS uses zip codes to aggregate local addresses and facilitate mail delivery, but does not publish an official dataset defining zip code areas. Also, some zip codes refer to post office locations or large customer sites and are only represented by point locations. Nonetheless, many agencies, including the U. S. Census Bureau, use zip code areas to divide the country into discrete, contiguous, non-overlapping sectors that are commonly used to report demographic data and perform spatial analysis.
In order to answer the spatial question posed by the researcher, I used a list of the “source” zip codes and two spatial datasets from ESRI:
- A set of points representing all of the discrete zip code points and the centroid point for all zip code areas. (n=41139)
- A set of polygons representing zip code areas. (n=30745)
Analysis workflow
- Ensure that the spatial coordinate system is appropriate for distance analysis.
- Join the list of zip codes to points and save the matched “source” records (n=2788).
- For each “source” zip code, find all neighboring zip codes within 50 miles.
- Create an output list pairing each “source” zip with all associated neighbor zips.


This analysis generated a table with more than 800,000 matched pairs. Professor Gopalan is using these results to study the relationship between attributes of the “source” zip codes and their paired neighbors. This project illustrates how a simple analysis can provide spatially based results to a researcher who plans to perform additional statistical or other analyses.
The Data Services team is happy to assist Washington University faculty, students, and staff with projects involving data analysis, management or curation. Contact us to discuss your needs and find out how we can help.
