
Faculty Project Uses GIS to Explore History of Racial Violence
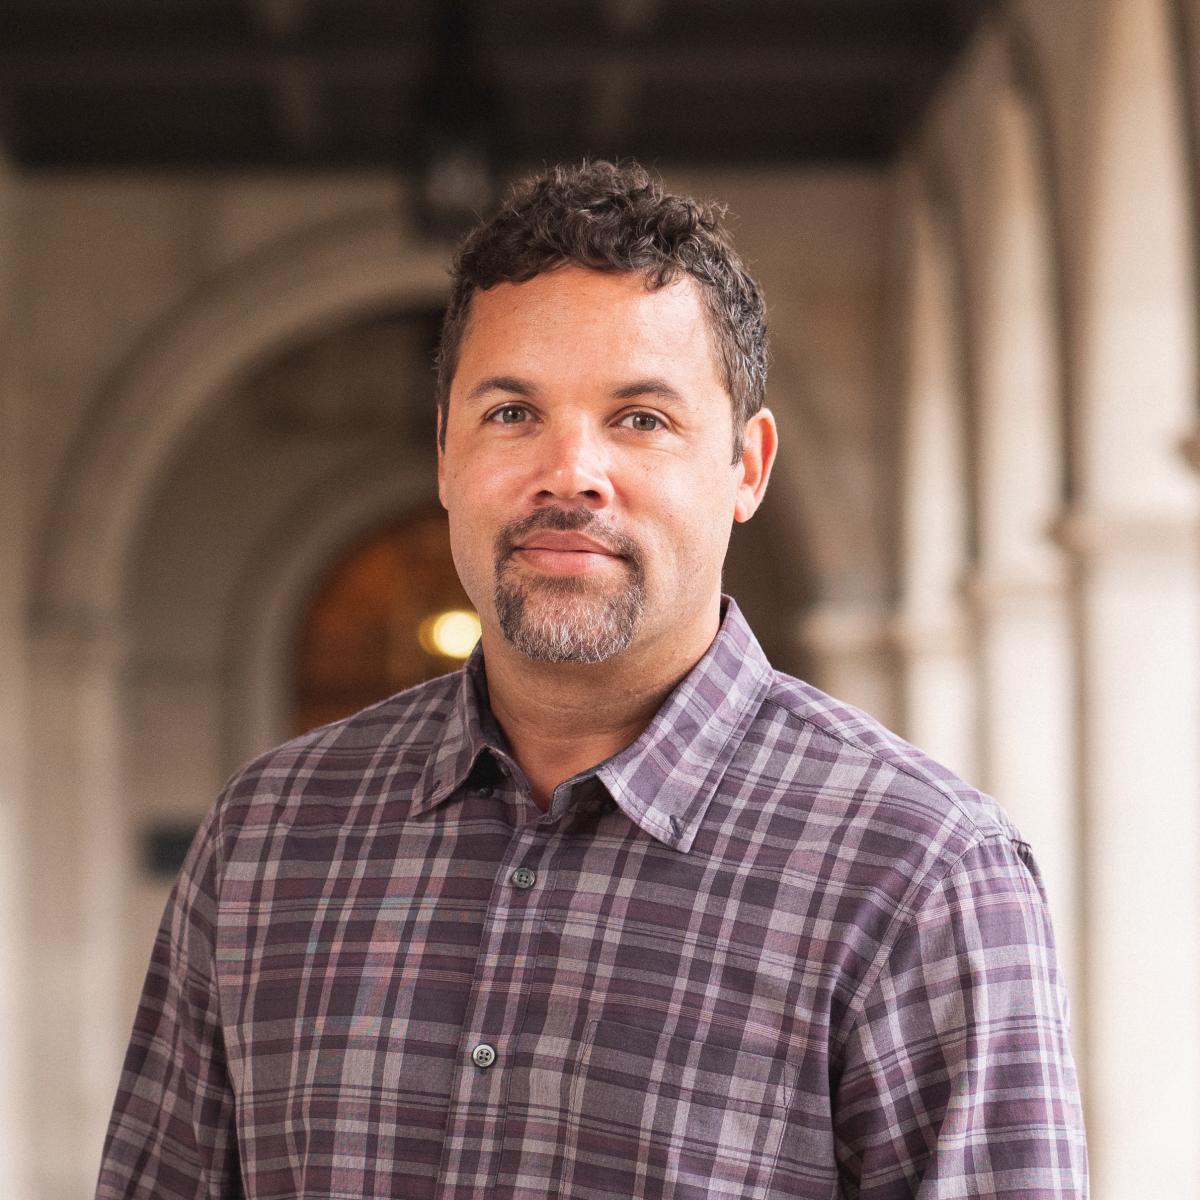
Geoff Ward is associate chair of Washington University’s Department of African and African-American Studies, where he is associate professor. His project the Racial Violence Archive is an interactive digital research tool that uses geographic information systems (GIS) to explore the history and legacies of racial violence.
To kick off Geography Awareness Week, starting Monday, there will be a pop-up exhibit of the Racial Violence Archive on Level 1 of John M. Olin Library. Dorris Scott, social science data curator & GIS librarian at the Washington University Libraries, recently spoke with Professor Ward about the project.
How did The Racial Violence Archive get its start? The project started 12 years ago, when I was invited to Mississippi for a meeting that was imagined as the start of a project called the Mississippi Truth Project. A number of activists and academics were invited to help conceptualize this effort and get it going. At that meeting, I and a couple of social scientists, including David Cunningham [professor and department chair of sociology at WashU], decided we would step aside from the organizing work and begin to do some basic research on racial violence and its legacies in Mississippi.
My role was to begin developing a database of race-related political violence historically, so that was the beginning of the Racial Violence Archive. I got into the work of trying to document histories of racial violence and decided that I should approach it in a way that would be visible and interactive. That’s what led me to the digital project.
What GIS tools did you use? I’m getting to the point in my journey now that I’m trying to learn how to use ArcGIS Online and StoryMaps. But for the first five years or so, we were doing standard sociological research and using Excel databases. The digital project was born out of a class that was taught at my previous institution [University of California-Irvine] in the informatics department, where students were tasked with developing technology tools to address problems that faculty would bring to them. My problem was how can I visualize these data to do the kinds of things I wanted to do. In that class, students worked with Google Fusion Tables, Leaflet, and other kinds of mapping applications.
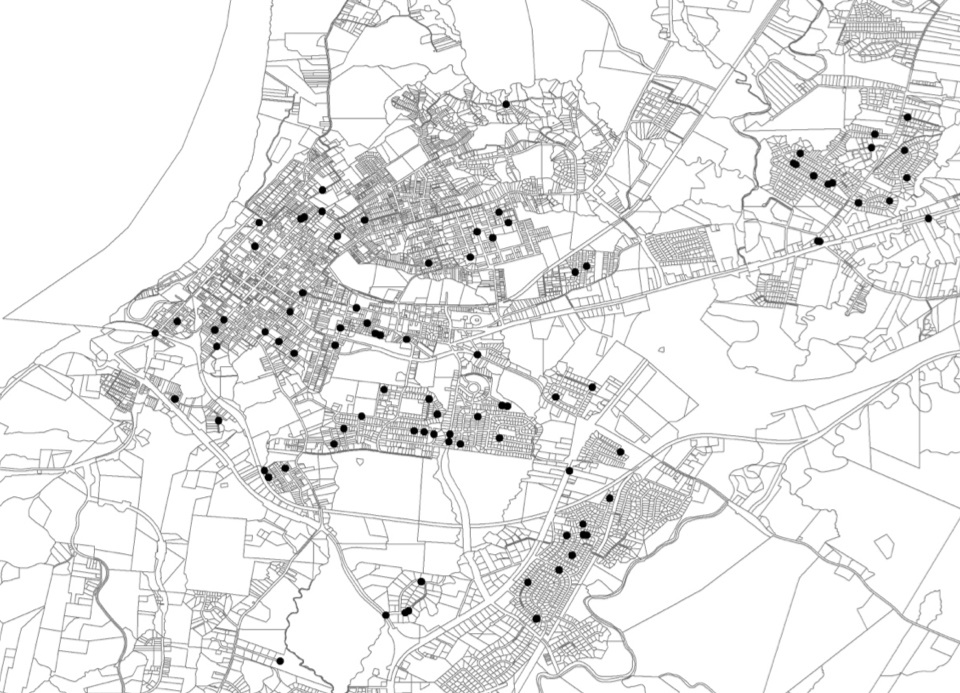
Why was it important for you to add a geographic perspective to this project? The geographic perspective is important on a couple of key levels. One is analytics. We know from this body of work now that histories of racial violence at the county level are predictive of a number of contemporary outcomes—outcomes of violence, conflict, and inequality. When you look at that relationship in, say, a dataset table, the county names are not particularly meaningful. They don’t tell a story in a table the way they do when you map them geographically. For example, one of the questions we continue to wrestle with is how important are county boundaries in understanding why or how histories of lynching or enslavement relate to subsequent outcomes. By visualizing the data geographically, we can look at the data differently. We can look at how clusters of counties with more extensive histories of racial violence are oriented or look at the relationships between counties that are in adjacent states. Those insights are harder to glean—really impossible to glean—by just looking at words in a dataset.
The other main reason for moving to visualization geographically is that I want this work to engage the public. I want people to reflect on what this work is telling us. We remain literally haunted by these histories of racial violence, and those hauntings are pronounced in particular places. So I want people to grapple with that and think about what we might do collectively to address that, and I think that a map is a very valuable way to do that insofar as people understand themselves in relation to place and their stories in relation to place.
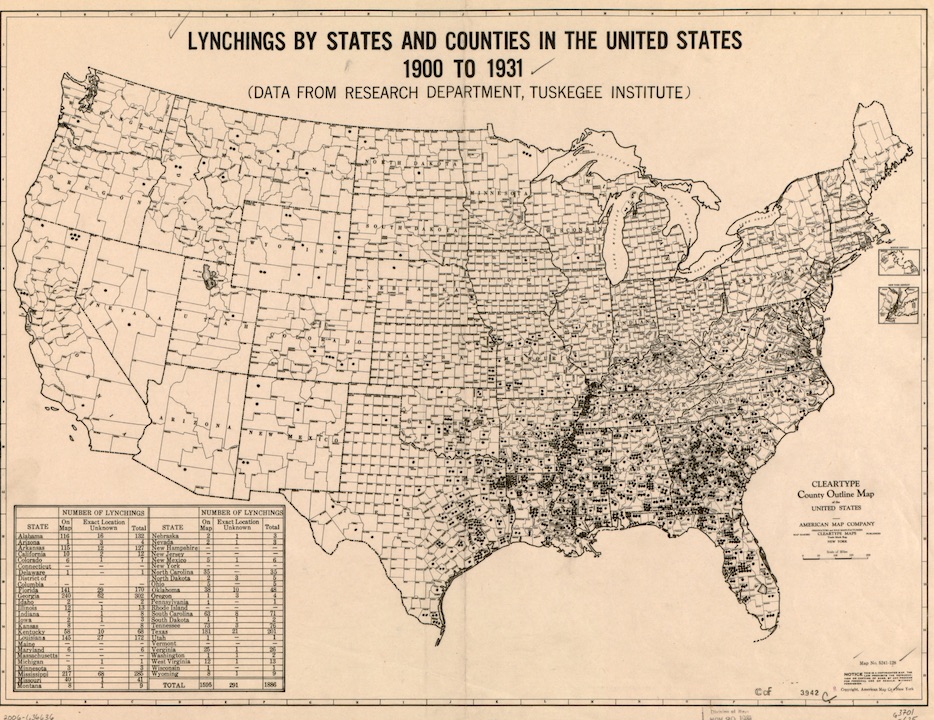
What makes The Racial Violence Archive unique? Globally, you see efforts to acknowledge histories and legacies of racial violence. What’s unique about this project is its scope. Most of the work in the U.S. context is focused exclusively on histories of lynching. With our project, we’ve attempted to push beyond that category to include other kinds of atrocities—things like church burnings, assassinations of civil rights activists, police violence of a political nature to suppress activists, and so forth. Acts of racial terror that did not meet the technical definitions of lynching we attempted to include in our representation of this history. That’s a key distinction of this approach. There are other ambitions perhaps, that distinguish this project, including the ambition that the database be highly interactive, not only so people can manipulate the data but so they can contribute to the database—identify missing information, suggest cases that should be added. We’re hoping that ultimately the database will be a tool that people can use for their own research.
What issues have arisen during this project? Probably the biggest issue from a geospatial point of view is that many of the events we’re interested in documenting and analyzing have missing and incomplete location data. Information about where they happened is often limited to the name of the county, which is a pretty large area. In some cases, we have names of sites that no longer exist. For example, we were not able to locate black churches that were targets of terroristic activity using historical newspapers and Google searches and Wikipedia and the like. They are sort of missing from the landscape.
Related to that, the silences around these events generally are a challenge. The reason we don’t know where a lot of things happened is in large part because the mainstream press and other institutions conspire to erase these histories or to remain silent about them.
Another issue is deciding what events to include. Racial violence, in a very broad sense, includes not just direct violence, violence against a person or a body, but also structural violence and cultural violence. Utterances of racist jokes are racially violent in a cultural sense but nearly impossible to document, systematically, so that they can be represented on a map. In terms of structural violence, the organization of society in a way that is harmful to select populations is not something we’ve been able to focus on documenting. We do think over time that this is the kind of information that could be an additional layer, at least to some extent. Patterns of voter suppression as a form of structural violence or disparity and the provisions for school and healthcare are layers that might be added.
What is the future for the Racial Violence Archive? My hope is that we develop an interface that is durable, that will withstand the test of time, and will do the types of things we’re looking to do, like facilitating interactivity. I don’t think it will be complete in the sense that there will be a complete record of everything that’s ever happened. In theory, the project will just continue to grow and capture more of the historical memory that is important here. In doing that, the hope is that it becomes an archival resource that will help to sustain research around these issues—not just research on whether or not and how histories of racial violence remain impactful but a needed new wave of research that asks how the reckoning efforts underway today are changing that story, if at all.
I get occasional calls and emails from journalists who are writing stories about some event and are wanting to historically contextualize that event. The hope is that the database will be sufficiently robust and that the user interface will be sufficiently accessible and compelling that people can just go directly to that source and find information they need to do that kind of work.
Why do you think it’s important for people to be more geographically aware? We know so much from the social science research about the relationship between place and outcomes. The relationship between race and place is so profound that you can’t really understand race, racism, racial inequality, and the challenges of racial justice without being engaged with the dynamics of place. I’m sure other patterns exist across other realms of research. Another reason is that we are so invested in spatial dynamics and ideas about place, the identities of place. I think it’s an important part of the way we exist in the world. I think it will beneficial for people to develop skills to communicate even more effectively with respect to place and its meaning in our lives.
This interview was edited for brevity and clarity.