Impact Report

These figures and graphs capture the impact and development of the WashU Libraries’ collections, core services, remote support, outreach efforts, and more for FY24 (July 2023 through June 2024).
Figures include all WashU Libraries except where otherwise indicated.
Collections | Circulation & Collection Use | Expanding Digital Resources | Instruction & Outreach | Reference & Research Support | Events & Engagement | People | Space & Usage | Expenditures | Ranking Results
Collections
| Print books | 1,979,170 |
| Print journals | 50,338 |
| E-books | 2,882,604 |
| E-journals | 239,211 |
| Databases | 1,220 |
| Other formats* | 528,633 |
| Total research collections base | 5,681,176 |
*Other formats include microforms, audiovisual materials (physical, streaming video, digitized music), manuscripts, architectural drawings, photographs, maps, etc.
Circulation & Collection Use
| Initial physical circulations (includes general and reserves) | 45,625 |
| E-books viewed/used | 220,796 |
| E-journals viewed/used | 4,212,690 |
| Repository downloads | 1,261,850 |
| Inter-institutional loans (includes ILL and Mobius) | 20,016 |
| Inter-institutional borrowed | 18,870 |
Expanding Digital Resources
| Collection materials digitized | 45,634 |
| Audiovisual material | 76 hours, 57 minutes, and 17 seconds |
| University repository (Open Scholarship) contributions | 3,341 |
Collections & Services Highlights
Explore More NewsInstruction & Outreach
| Instruction sessions (in-person and virtual) | 1,277 |
| Instruction session participants | 19,057 |
| Number of different departments reached through instruction | 33 |
Reference & Research Support
| Reference consultations (in-person and virtual) | 19,917 |
| Reference consultations per day | 55 |
| Data Services Help Desk Sessions | 1,150 |
| Chats and support tickets addressed | 2,663 |
Usage & Outreach Highlights
Explore More NewsEvents & Engagement*
| Public events (In-person and virtual) | 163 |
| Event attendees | 3,804 |
| Social media followers (primary Libraries accounts only) | 6,003 |
| Libraries’ website views | 2,054,610 |
| Search box events | 186,245 |
| Searches per day | 510 |
*Does not include Bernard Becker Medical Library, Brown School Library, or Law Library
People
| Total full-time staff | 200 |
| Recruitments* | 17 |
| New positions* | 8 |
*Does not include Bernard Becker Medical Library, Brown School Library, or Law Library
Events & Engagement Highlights
Explore More NewsLibraries Space & Usage*
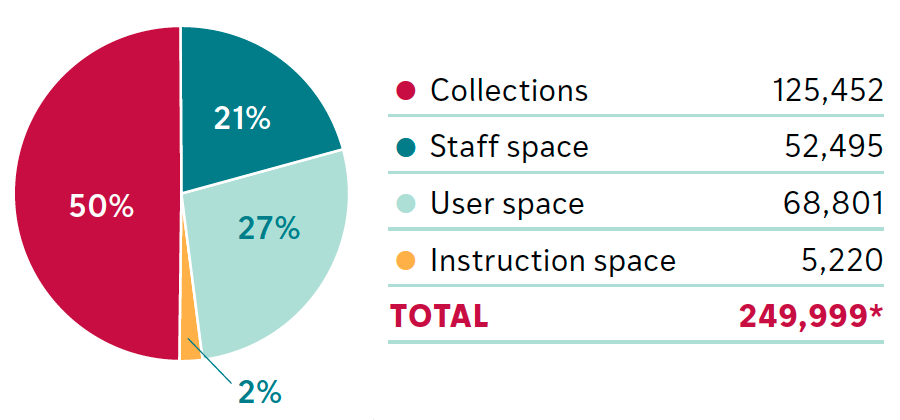
| Collections | 125,452 |
| General collections | 101,155 |
| Special collections | 24,297 |
| Staff space | 52,495 |
| User space | 68,801 |
| Quiet study | 40,555 |
| Collaborative | 26,738 |
| Exhibition viewing | 1,508 |
| Instruction space | 5,220 |
| Total* | 249,999* |
* Library space is measured in square feet. Some spaces are multi-purpose and counted in more than one category. Figures do not include Bernard Becker Medical, the Law Library, and the Brown School Library.
Visitors
| Total visitors* | 861,068 |
*Does not include Bernard Becker Medical Library
Room Reservations
| Total reservations | 12,325 |
| Unique users | 2,592 |
*Does not include Bernard Becker Medical Library, the Law Library, and the Brown School Library.
Spaces & Operations Highlights
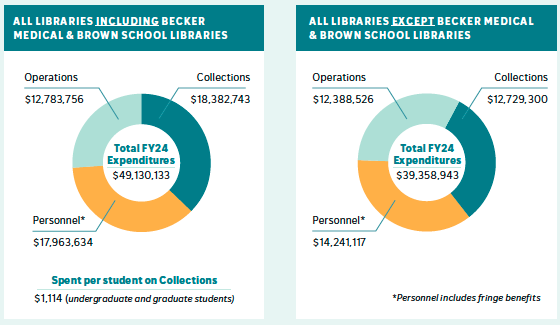
Explore More NewsFY24 Expenditures
*Personnel includes fringe benefits
Ranking Results
| Association of Research Libraries (ARL) Investment Index (FY23*) | 27 |
| Princeton Review Best College Library | 14 |
*ARL is always a year behind.


