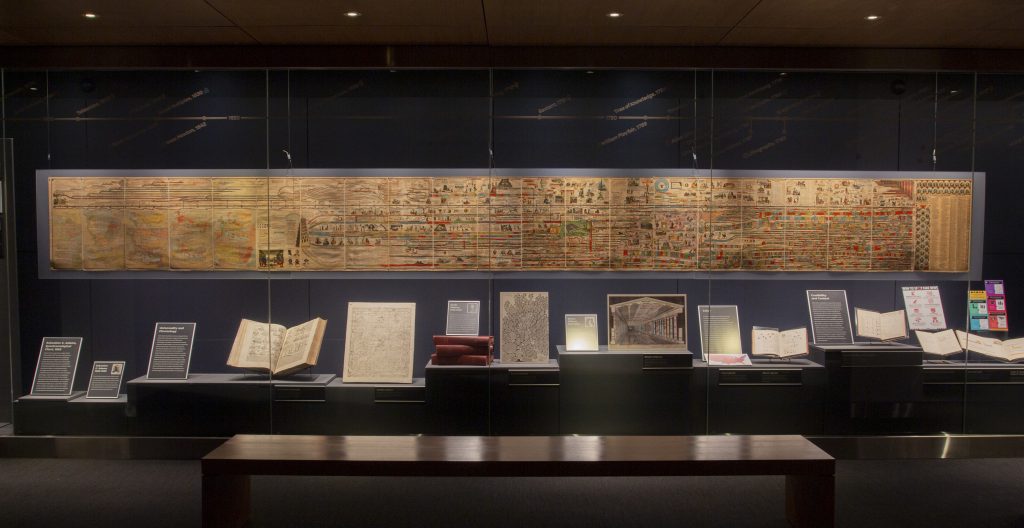
Charting History
Charting History: Data Visualization Through the Years includes examples from the libraries’ collection and presents a history of data visualization to illustrate the importance of data visualization as it relates to research and disseminating information.